Driving on Quebec’s clean energy
If there is one place in the world where running electric makes perfect sense, it is in Quebec!
The place in the world where electric driving makes the most sense
Almost everywhere in the world, replacing gasoline (or diesel) with electric vehicles is already beneficial from an environmental point of view. But it's where electricity is generated in a clean, renewable way that the benefits are greatest.
Good thing, 99% of the electricity produced in Quebec comes from our rivers or the wind. Quebec is one of the places in the world where the consumption of electrical energy contributes the least to climate change.
Replace the worst oil...
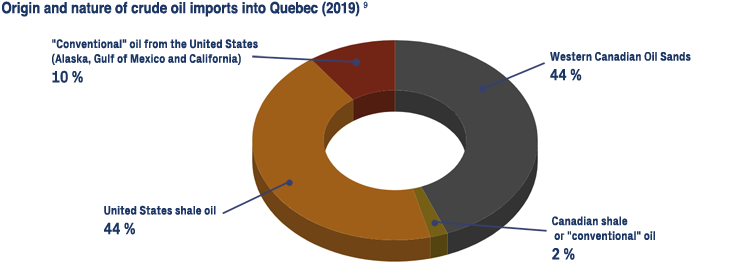
Running electric in Quebec is not only driving with the cleanest electricity in the world ... it is also AVOIDING driving with one of the most polluting gasolines in the world.
Since 2019, 100% of crude oil imported into Quebec comes from Western Canada and the United States. The source of the gasoline that powers Quebec cars is mainly shale oil and the tar sands of Alberta.
... with the best electricity
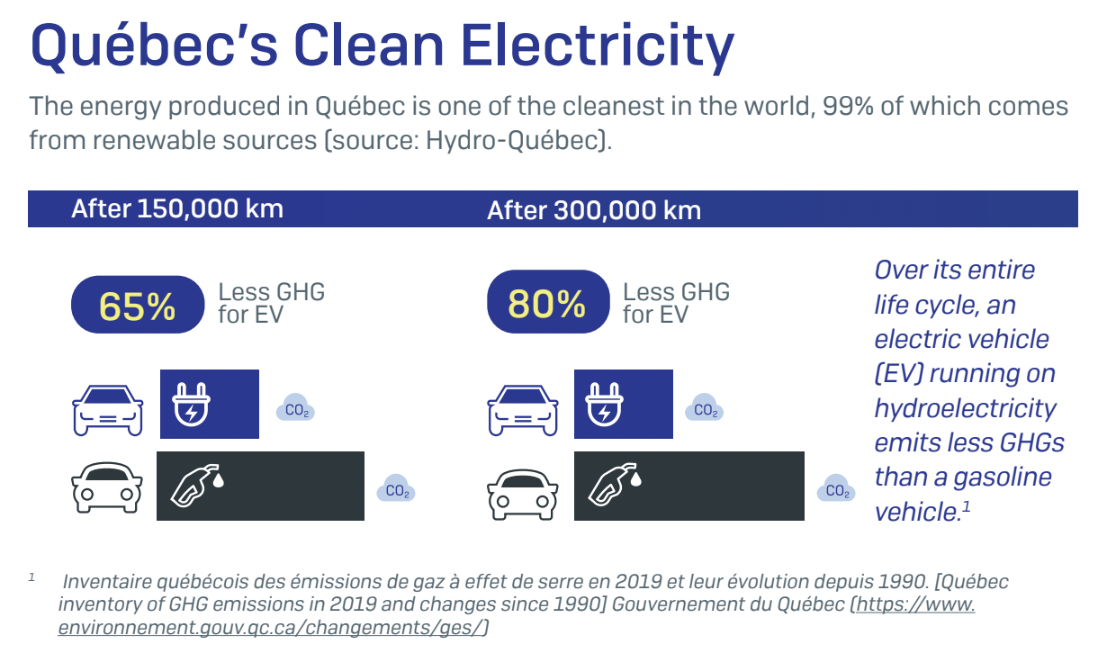
The energy produced in Quebec is one of the cleanest in the world, more than 99% from renewable sources.
Thus, the environmental impact of electric vehicles is particularly positive for us, especially for the fight against climate change.
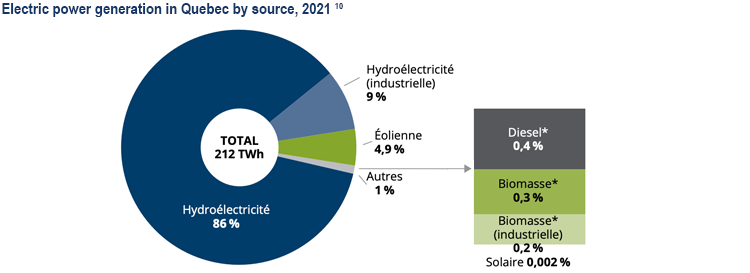
Figure references :
1- National Inventory Report 1990–2017: Greenhouse Gas Sources and Sinks in Canada - part 3 (2021)
2- For European countries : European Environment Agency (EEA) - Greenhouse gas emission intensity of electricity generation (2021)
3- For the United States : International Energy Agency (IEA) - Development of CO2 emission intensity of electricity generation in selected countries, 2000-2020 (2021)
5- For Australia and data consistency check : 2019 Grid Electricity Emissions Factors v1.0 – June 2019, Carbonfootprint.com
7- For types of power plants : Comparing power generation options and electricity mixes. CIRAIG, 2014 (Technical report ordered by Hydro-Quebec)
8- Human health and ecosystem impacts : Comparing power generation options and electricity mixes. CIRAIG, 2014 (Technical report ordered by Hydro-Quebec)
9- Proportions of oil imports from : État de l’énergie au Québec 2021, Chaire de gestion du secteur de l’énergie, HEC Montréal and Profil environnemental du gaz naturel acheté et vendu par Énergir, CIRAIG, 2020.
10- Figure from : État de l’énergie au Québec 2023, Chaire de gestion du secteur de l’énergie, HEC Montréal.
